Detailed Description
https://wiki.rusefi.com/Developer-Performance-Tracing
See JsonOutput.java in rusEfi console
Definition in file perf_trace.cpp.
Enumerations | |
| enum class | EPhase : char { Start , End , InstantThread , InstantGlobal } |
Functions | |
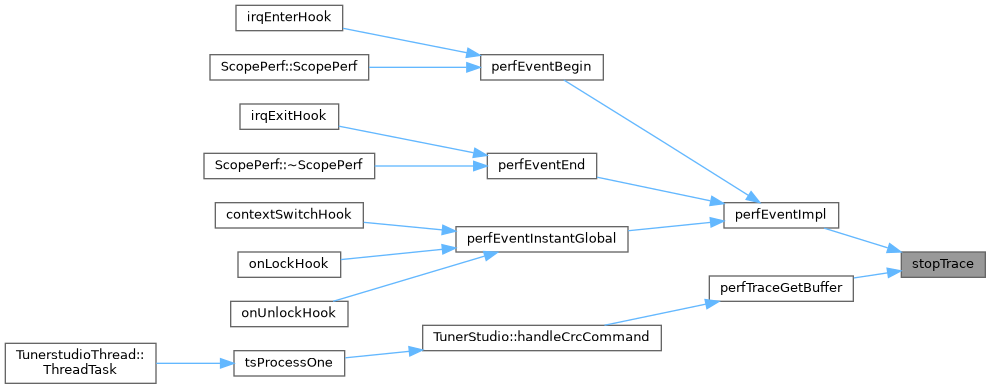
| static void | stopTrace () |
| static void | perfEventImpl (PE event, EPhase phase) |
| void | perfEventBegin (PE event) |
| void | perfEventEnd (PE event) |
| void | perfEventInstantGlobal (PE event) |
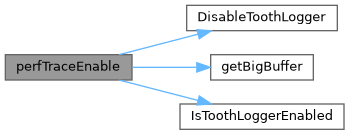
| void | perfTraceEnable () |
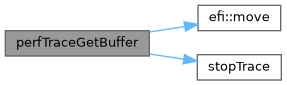
| const BigBufferHandle | perfTraceGetBuffer () |
Variables | |
| static BigBufferHandle | s_traceBuffer |
| static size_t | s_nextIdx = 0 |
| static bool | s_isTracing = false |
Enumeration Type Documentation
◆ EPhase
| Enumerator | |
|---|---|
| Start | |
| End | |
| InstantThread | |
| InstantGlobal | |
Definition at line 15 of file perf_trace.cpp.
Function Documentation
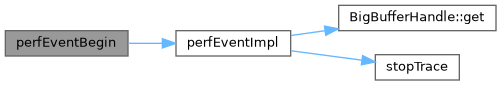
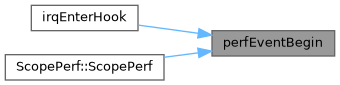
◆ perfEventBegin()
| void perfEventBegin | ( | PE | event | ) |
Definition at line 109 of file perf_trace.cpp.
Referenced by irqEnterHook(), and ScopePerf::ScopePerf().
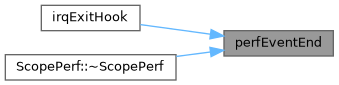
◆ perfEventEnd()
| void perfEventEnd | ( | PE | event | ) |
Definition at line 113 of file perf_trace.cpp.
Referenced by irqExitHook(), and ScopePerf::~ScopePerf().
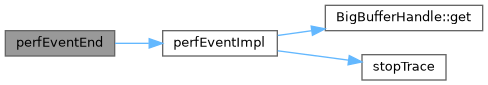
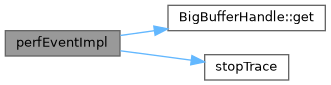
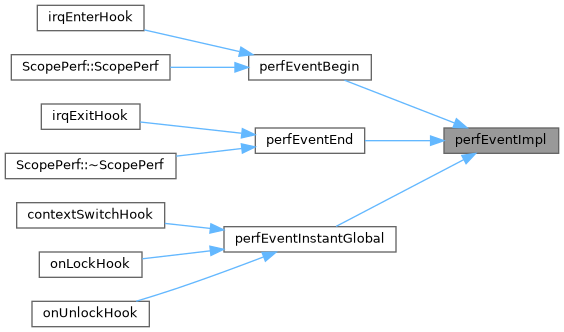
◆ perfEventImpl()
Definition at line 48 of file perf_trace.cpp.
Referenced by perfEventBegin(), perfEventEnd(), and perfEventInstantGlobal().
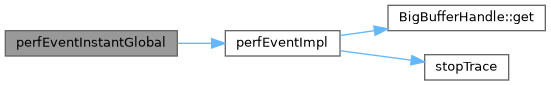
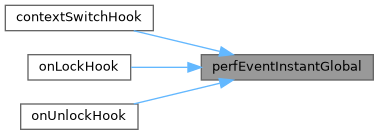
◆ perfEventInstantGlobal()
| void perfEventInstantGlobal | ( | PE | event | ) |
Definition at line 117 of file perf_trace.cpp.
Referenced by contextSwitchHook(), onLockHook(), and onUnlockHook().
◆ perfTraceEnable()
| void perfTraceEnable | ( | ) |
Definition at line 121 of file perf_trace.cpp.
Referenced by TunerStudio::handleCrcCommand().

◆ perfTraceGetBuffer()
| const BigBufferHandle perfTraceGetBuffer | ( | ) |
Definition at line 134 of file perf_trace.cpp.
Referenced by TunerStudio::handleCrcCommand().

◆ stopTrace()
|
static |
Definition at line 43 of file perf_trace.cpp.
Referenced by perfEventImpl(), and perfTraceGetBuffer().
Variable Documentation
◆ s_isTracing
|
static |
Definition at line 41 of file perf_trace.cpp.
Referenced by perfEventImpl(), perfTraceEnable(), and stopTrace().
◆ s_nextIdx
|
static |
Definition at line 39 of file perf_trace.cpp.
Referenced by perfEventImpl(), and stopTrace().
◆ s_traceBuffer
|
static |
Definition at line 38 of file perf_trace.cpp.
Referenced by perfEventImpl(), perfTraceEnable(), and perfTraceGetBuffer().